Connection diagnostics for people who have been told it’s fine

A packet that arrives too late is lost. Your speed test never checked.

Your speed test measured an idle line at full throttle and told you 480 Mbps. The thing that ruined your gunfight lasted a second and a half, happened while somebody was uploading, and consisted of packets that turned up after they were any use. Bullettime is built to catch exactly that.

No account, no card The free result is the whole result Runs on your own box for $9.99

A sample Bullettime result. Every figure is computed from one seeded synthetic session of 2,847 probes; nothing here came from a real connection.
Diagnostic complete 02:04 elapsed

Warzone is likely degraded while anyone is uploading.

Direct path
LONGEST HOLE 1,420ms
HOLES / MIN 1.5
RTT p95 · IDLE 28ms
RTT p95 · UPLOADING 441ms

The hole is the headline because it is the figure that survived our own testing (we published the workings). Underneath it, the composition, never merged into one number: while the line was busy going up, the 413 probes in that epoch sorted as:

  • on time
  • arrived too late
  • never arrived

n = 413 95% CI ±4.4 pp

A stroboscopic photograph of eleven identical spheres frozen in flight across a black field. A thin vermilion plane of light cuts the frame near the right. The spheres before the plane are brightly lit; the ones past it have fallen into shadow.

Everything left of the line made it. Everything right of it was delivered, and was useless.

The idea the whole product is built on

Your jitter buffer already played past it. The game tick it belonged to was already simulated and drawn.

A 200 ms arrival is fine for Netflix, survivable for a call, and gone for a 60 Hz shooter, so the honest thing is to refuse to pick your deadline for you and give you the axis instead. Drag it. How much a packet’s lateness costs you is the part we have actually measured; how best to summarise it in one number is the part we got wrong first time.

Deadline

16.6 ms

4 ms240 ms

On time 0

Arrived too late 0

Never arrived 0

Deadline‑miss rate 0%

n = 413upload epoch of the sample session

This scene needs WebGL, which this browser has turned off.
The same figures are in the panel beside it, and the deadline control still works.

One volley, frozen: every probe sent during the eighteen seconds the line was busy going up, placed by how long it actually took. Hollow marks past the plane arrived and were useless. Solid marks never arrived at all. The scene is a picture of a distribution rather than a decoration, and moving the plane runs the same arithmetic the product runs.

Why a percentage is the wrong shape

Both of these are one per cent loss. Only one of them lost you the fight.

Loss clusters. Measured traces run 20–30% density inside a burst for several seconds at a time, and a mean percentage cannot tell the two pictures below apart. So Bullettime keeps the raw received‑or‑lost sequence for every probe and reports the shape: run lengths, the longest hole in milliseconds, and how many holes per minute.

Spread evenly 1.0%

longest hole 21 ms2 holes / min

Invisible. Concealment covers it and nobody notices.

Arriving as one hole 1.0%

longest hole 1,420 ms1 hole / min

A frozen face, a dropped call, a gunfight you were never in.

This is the best-evidenced claim on the page. We put the longest hole up against conventional packet loss, mean latency, RFC 3550 jitter and RFC 5481 delay variation across 1,344 simulated sessions, pre‑registered, on a fresh seed, and it beat all of them. It also beat the deadline‑miss percentage we used to lead with, which is why we no longer do. The workings are published, including the two runs that went against us.

Microsoft’s own call-quality documentation makes the same argument: a 1.5 second gap dilutes into a low whole‑call average while producing 30% loss inside a five‑second window. Every other consumer tool reports the average.

The measurement contract

A saturating speed test manufactures the lag it should be measuring.

Fill the buffers, measure latency during it, then call the result “your latency”, and you have reported the test’s own effect as a property of the network. So a session is a sequence of epochs, each with its own low‑rate probe lane on a separate flow and a separate server queue. Loaded figures are reported as loaded figures and never merged with idle ones.

The clock below is the point. Pick any epoch and it jumps, because these are sequential minutes apart on purpose. Nothing here is one simultaneous instant, and a tool that renders it as one is showing you something it did not measure.

Session clock at this epoch

00:04 → 01:02 the only epoch allowed to be called idle

Load: probes only

Idle baseline

Loading…

What you actually get back

Six surfaces, and the free result carries every one of them.

These are the real surfaces, not illustrations of them. Nothing below is withheld from the free tier to manufacture a reason to upgrade; what the paid plans buy is the work a browser tab structurally cannot do.

Deadline misses — upload epoch Direct path
  • arrived too late  0%
  • never arrived  0%
  • n = 413

Deadline survival curve — misses against assumed buffer depth

n = 41395% CI ±0 ppT obs = 3,000 ms

A clean result never prints “0%”. It prints the measured figure with the sample count and interval that make it a claim rather than a reassurance.

Burst structure Download and upload epochs

Received or lost, per probe, across the loaded epochs

LONGEST HOLE0ms
HOLES / MIN0
MEDIAN RUN0pkt
LONGEST RUN0pkt

A Gilbert–Elliott fit is available and is suppressed here, because this trace holds too few state transitions for the parameters to be stable. Fitting a two‑state model to a nearly lossless trace invents structure.

By application Deadline 16.6–200 ms

Call of Duty: Warzone

threshold basis
unvalidated inference Activision publishes no numeric requirement, only that broadband is required. The 16.6 ms figure is a 60 Hz tick budget, which is this project’s own reasoning and not a measured breakdown point.

Likely degraded now

Zoom

threshold basis
vendor recommendation Zoom publishes ≤150 ms latency, ≤40 ms jitter, ≤2% loss. Those are targets for a different purpose than diagnosis, so they are a recommendation and not a breakdown point.

At risk when busy

WebRTC audio

threshold basis
independently measured Your one‑way trace was replayed through a pinned libwebrtc NetEQ and we report what it would have discarded. Reference‑implementation parameters, labelled as the reference’s, not as anyone’s product.

At risk when busy

Netflix

threshold basis
vendor minimum 3 Mbps for 720p, 5 Mbps for 1080p, 15 Mbps for 4K, published by Netflix as a floor. A deep buffer absorbs the delay variation that breaks the others.

Likely fine

GeForce NOW

threshold basis
vendor recommendation NVIDIA publishes 25 Mbps for 1080p60 and latency under 80 ms. Our endpoint is not theirs, so this is access‑link quality and not evidence about the path to their servers.

Path mismatch

Five verdicts, and one of them is “we cannot assess this from here”. Every competitor ships per‑application presets with no provenance at all.

The path this measured
Last 24 hours Anchor: study iMac, wired

288 windowslight probe, 5 pps, 10 s, every 5 min

Your line got worse at 20:05, and it is still worse.

Deadline misses have run six times your own weekday evening baseline for 47 minutes. Calls and games are the things this affects. It is not a single bad sample.

Fired against this household’s own established baseline, not a threshold. Why did this fire?

A period with too little data is reported as unmonitored, never as healthy.

Dispute pack 14 days, 4,032 windows
Deadline survival curve, per epoch PDF p.2
RFC 5481 PDV distribution, D99.9 − Dmin PDF p.3
RFC 3611 burst and gap densities, Gmin printed PDF p.4
Local gateway against remote endpoint, same session PDF p.5
Raw per‑probe sequence, every figure recomputable JSON
SHA‑256 of the session, so the pack can be checked manifest

Written to be read by someone who did not run it, which means it carries its own methodology rather than assuming the reader knows what the columns mean. Re‑exporting the same range produces the same document.

Available on the free tier for a single result, because arguing with an ISP is the free tier’s best story and gating it would be the wrong side of our own rule.

every figure on this page derives from one seeded sample session

Product rules, not aspirations

Six sentences this page will never print.

Each one exists because a tool you have already used prints it, and each one misleads. The bars below do not lift on hover. That is the point: the claim was never made.

  1. 01
    Redacted claim: we have isolated the problem to your Wi-Fi.

    A browser‑only remote test cannot separate your Wi‑Fi from your ISP, and saying so sends people out to buy routers they do not need. Separating them needs concurrent probes to your own gateway, which is what the native apps do and what a tab cannot.

  2. 02
    Redacted claim: hop 7 is dropping your packets.

    Routers forward traffic in hardware and generate the ICMP that traceroute reads on a rate‑limited, deprioritised path. Perfectly healthy routes routinely display alarming mid‑path loss. Any path view we ship is labelled route observations, not fault locations.

  3. 03
    Redacted claim: zero per cent packet loss, your connection is healthy.

    Zero out of forty probes means your real loss could be anything up to about 8.8%. A figure without its sample count and confidence interval is a reassurance rather than a measurement, so ours never ships without both.

  4. 04
    Redacted claim: your Warzone ping is 14 milliseconds.

    That was the round trip to our server, in our region. It is good evidence about your access link and no evidence at all about the path to Activision. When the endpoint does not represent the application, the verdict says path mismatch instead of inventing a number.

  5. 05
    Redacted claim: twenty-four seven background monitoring on your iPhone.

    iOS does not permit it. Background refresh is discretionary and historically gets about thirty seconds per launch, which is an event detector and not a monitor. No plan on our pricing page claims it, and the pricing page says so where a buyer would look rather than in a footnote.

  6. 06
    Redacted claim: recommended router for your connection.

    The free tier carries advertising, and networking hardware, ISPs and carriers, VPNs and “ping boosters” are excluded categories, published rather than merely honoured. A router advert beside a result reading this is consistent with queueing on your Wi‑Fi delivers, through a third party, exactly the conflict this product exists to avoid.

Five platforms, one measurement core

Windows, Mac, iPhone, iPad and Linux, sharing one Rust core and one result schema.

Same state machine, same statistics, same impact engine, same versioned result on every one of them. What differs is what each platform will actually let a program do, so each card says which rather than pretending the set is uniform.

  • Windows

    Native app + service

    Tray presence, monitoring that survives a reboot, raw sockets with TTL control, per‑hop history and Native Wi‑Fi telemetry.

    Runs the gateway‑versus‑remote comparison, which is the only honest way to separate your Wi‑Fi from the line.

  • macOS

    Native app + launchd agent

    Menu‑bar condition and the age of the last sample, CoreWLAN RSSI and PHY rate, ICMP probes, thirteen designed surfaces.

    Monitoring stopped, paused and running‑clean are three visibly distinct states, because a silent status area otherwise reads as a healthy connection.

  • iPhone

    Native app + Live Activity

    Sixteen surfaces, a read‑only Live Activity while a test runs, and a Lock Screen that pins the dark palette rather than inheriting one that flips.

    No background monitoring, here or on any plan. iOS does not permit it, whatever a competitor’s marketing says.

  • iPad

    Native app, multi‑column

    The sidebar build of the same thirteen surfaces, sized for a pointer and a keyboard rather than a phone scale stretched to fill.

    Same limit as iPhone on background work, and the pricing page states it rather than burying it.

  • Linux

    Headless agent + probe server

    The reference agent for a NAS, a homelab box or an OpenWrt router, plus the probe server itself. Configured and read without a display attached.

    A monitor on a laptop measures the laptop: it sleeps, it moves rooms, it joins a different network. This is the one that does not.

The web test runs in any modern browser and needs nothing installed. The native clients exist for the two things a browser genuinely cannot do: run when it is closed, and probe your own gateway.

Run the whole thing yourself

One command on a plain Linux box, and the probe is yours.

A measurement tool that publishes its server is making a checkable claim about its method. The probe server, the measurement spec and the result schema are open; any client can be pointed at your endpoint and complete a full session against it.

Your household’s connection history reveals your occupancy patterns. That is a large part of why local‑first and self‑hosted modes exist at all.

Get the licence — $9.99 once Read the spec

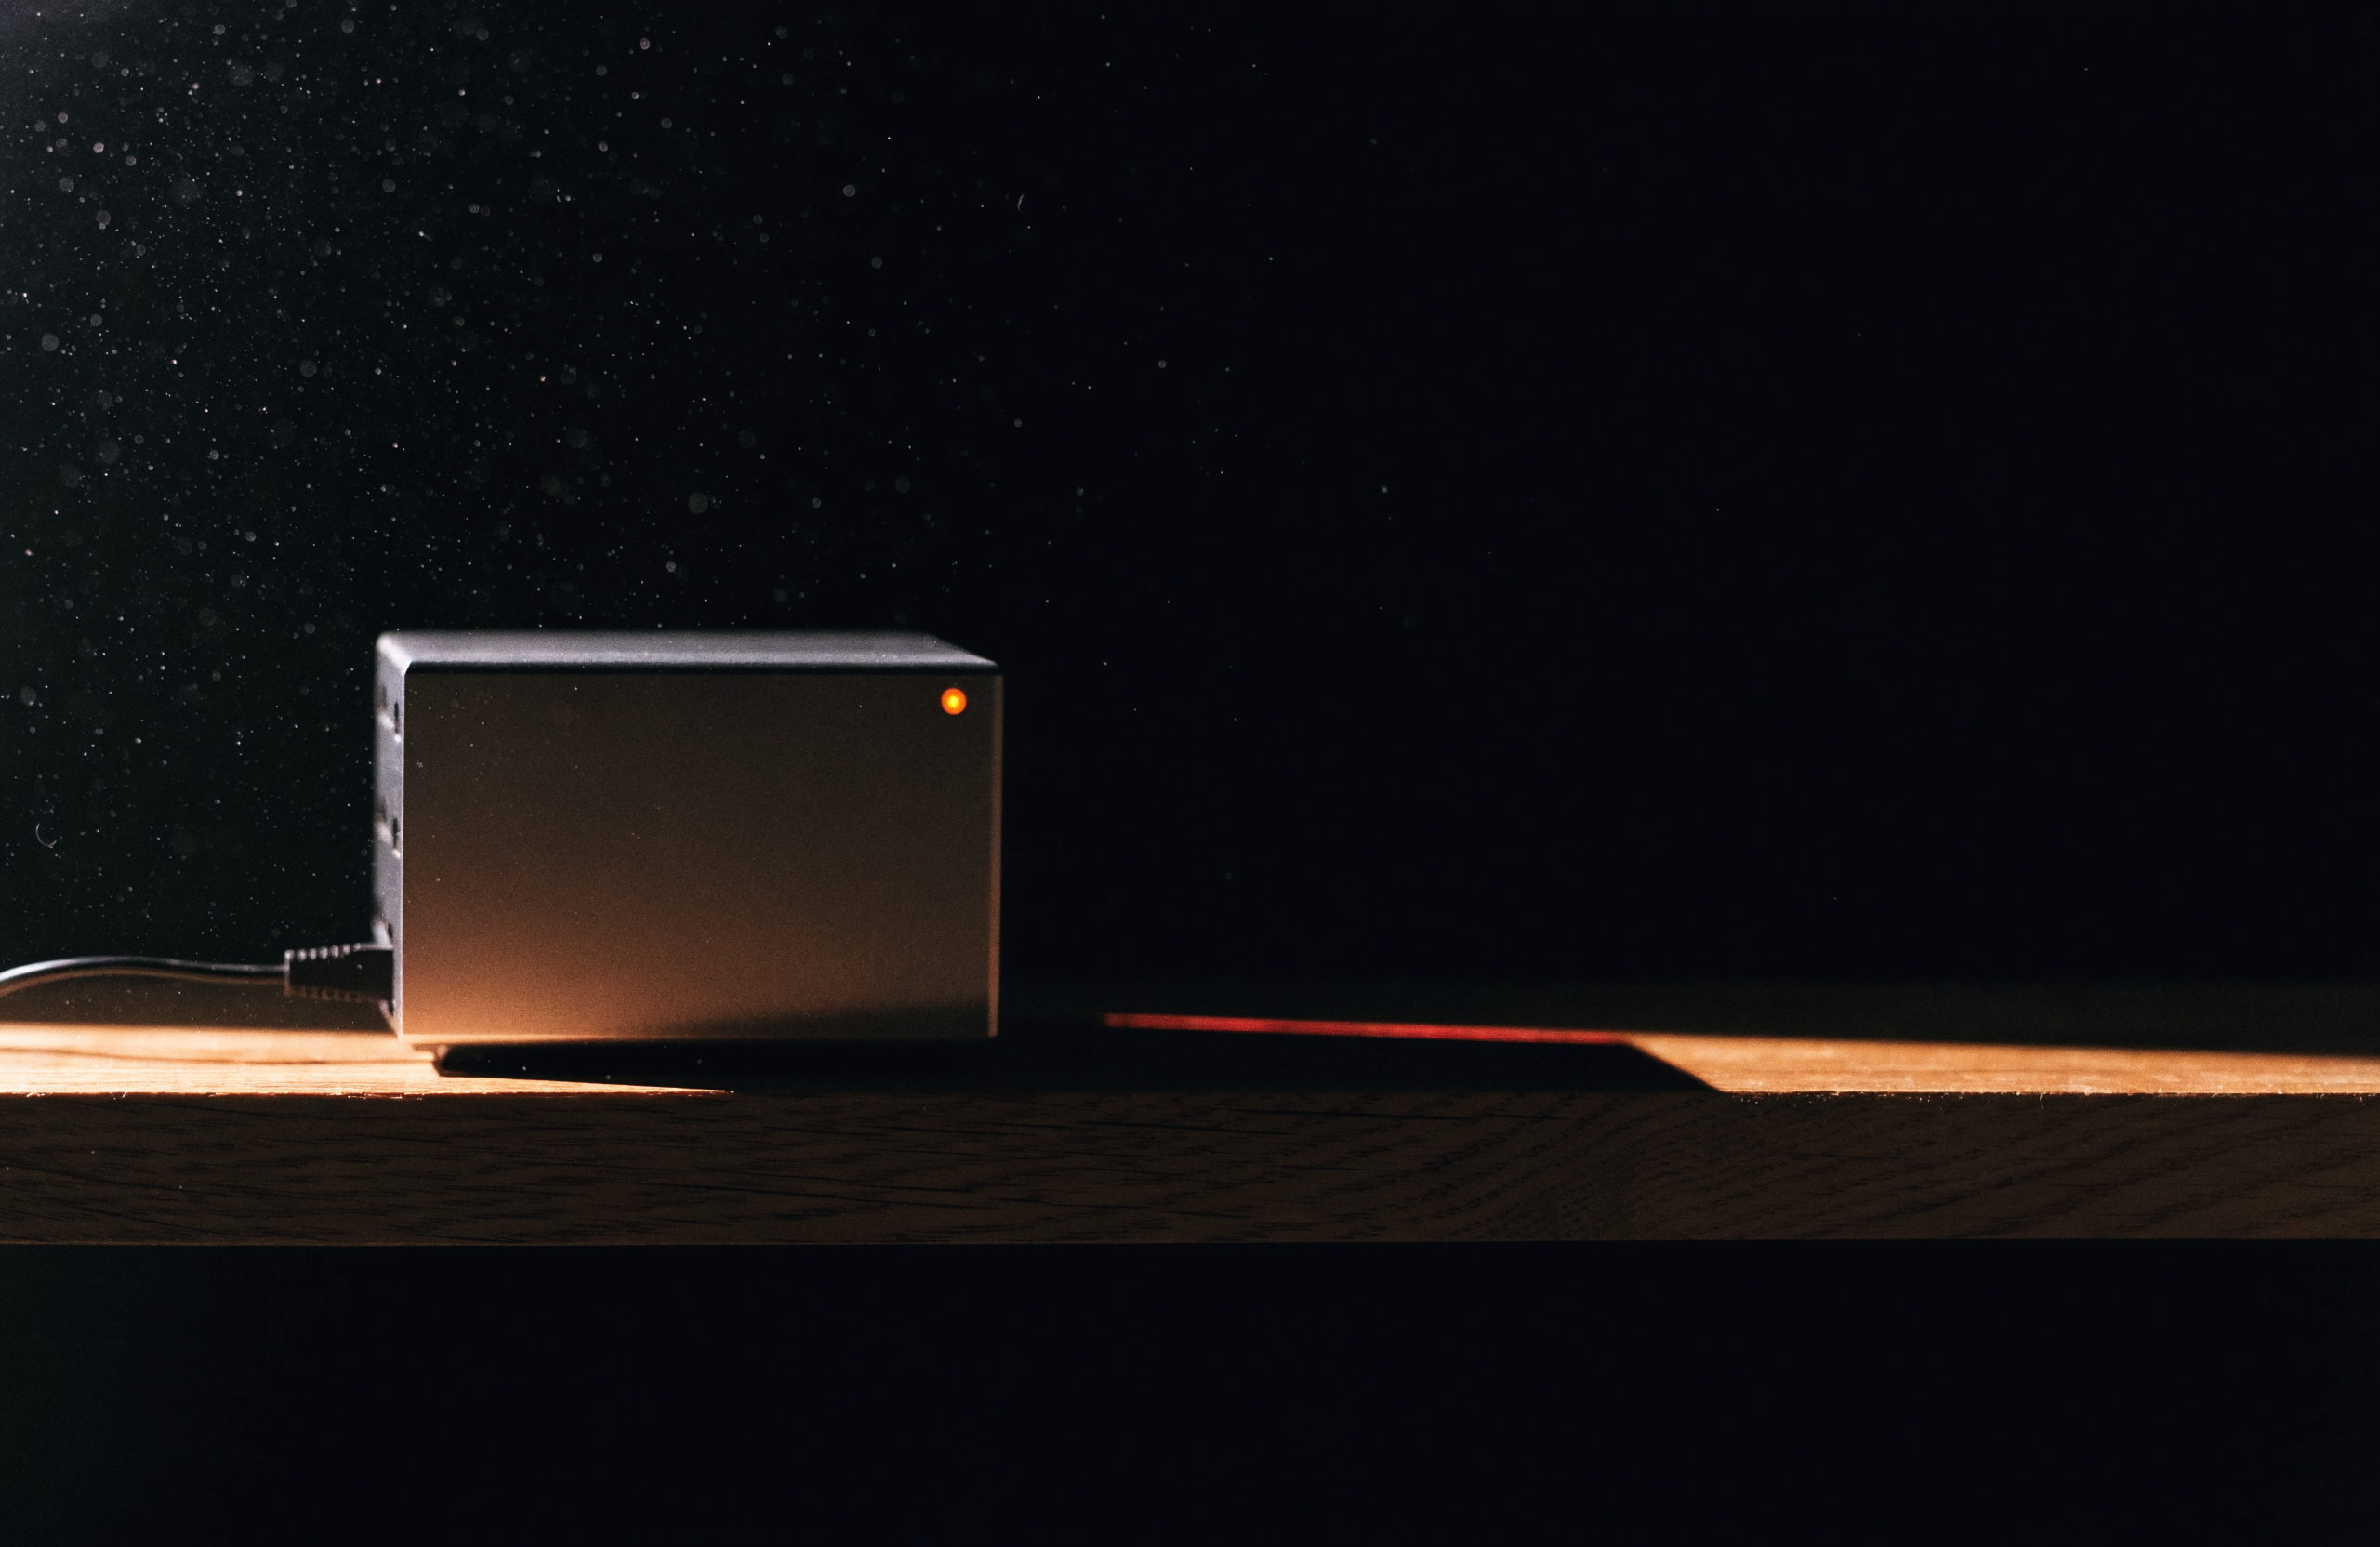
A small fanless aluminium mini-server on a bare wooden shelf in a dark room, one amber status light, a single ethernet cable disappearing into the dark, dust caught in a hard side light.
The best reference this product has is a box that never sleeps, on a wire. Everything else is compared against it.

And the part nobody else prints: where it will not work.

Two of the platforms people reach for first cannot accept inbound UDP, so a self‑hoster who tries either will hit a failure that looks exactly like a bug in this software. Saying so costs one paragraph and saves the support load.

Probe server hosting. Status refers to the UDP probe service, not the web tier.
TargetInbound UDPTURN relayVerdict
A $5 VPS
Hetzner, Linode, EC2, GCE
yesyesThe documented self‑host target. One container, one command.
NAS or homelab boxyesbehind NATWorks, and gives you the always‑on wired reference that the household comparison needs.
OpenWrt / pfSense routeryesnoThe agent cross‑compiles for MIPS, ARM64 and x86_64. At the gateway there is no Wi‑Fi contention in the way, so it is the purest view of the line.
Fly.iorestrictednoConditional, and we will not promise it until a deployment test settles it. Needs a dedicated IPv4, binds fly-global-services, has no UDP load balancing, and cannot open the wide dynamic port range TURN allocation needs.
VercelnonoWebsite, control API and result viewer only. There is no inbound UDP listener to bind, and there will not be one.
Cloudflare WorkersnonoSame story. Excellent for the web tier, structurally unable to host the probe.

Licence: probe server and shared analysis core under MPL‑2.0, which permits private and commercial self‑hosting and asks only that modifications to covered files stay available. Measurement spec and result schema under Apache‑2.0.

Pricing

Nothing is withheld from the free result.

The free test carries the same deadline‑miss figure, the same survival curve, the same burst view, the same path provenance and the same export as the paid one. What you pay for is the work a browser tab structurally cannot do: running when it is closed, telling you, and probing your own gateway.

Hosted by us

Free

$0forever

One test at a time, in a browser, on whatever you happen to be sitting at.

  • The full phased diagnostic
  • Deadline misses, survival curve, burst view
  • Per‑application verdicts with provenance
  • Dispute pack for a single result
  • Carries advertising, below the fold, never between a verdict and its evidence
Run a test

no account, no card

Most people want this

Hosted by us

Watch

$4.99/ month

Round‑the‑clock monitoring of one address, because the faults that matter are the ones that are not happening when you go looking.

  • Everything in Free, and:
  • A light probe every five minutes, aggregated into a history you can scrub by day and by hour
  • Alerts on a sustained departure from your own baseline, never on a single bad sample
  • Gateway‑versus‑remote attribution, from the native clients
  • 90 days of history, exportable as one timeline
  • No advertising
Start watching

cancel any time, keeps exporting for 30 days

Background monitoring on iPhone and iPad. iOS does not permit it, so this plan does not claim it. Monitoring runs from a Mac, a Windows machine, or a Linux box that stays on.

Hosted by you

Self‑hosted

$9.99once, not a subscription

Run the probe server on your own VPS or your own hardware, and keep the whole history on a machine you own.

  • Everything in Free, and:
  • The probe server, as a container, on any box that accepts inbound UDP
  • The headless reference agent for a NAS, a homelab box or an OpenWrt router
  • Unlimited addresses, unlimited history, none of it on our servers
  • Every native client can be pointed at your endpoint
  • No advertising
Buy the licence

one payment, all future versions

Bandwidth and abuse controls are on by default rather than opt‑in, because a saturating test at 1 Gbps moves about 3.75 GB and an open one will get found.

Watch and Self‑hosted are not tiers of each other. One is us running the probe and telling you when your line changes; the other is you running the probe and nothing leaving your network. Plenty of people want the second and nothing else.

What we refuse to sell

We tested our own claim. Part of it broke. 26 August 2026

We ran the experiment on ourselves first, and it told us we were measuring the right thing the wrong way.

The mechanism is not in question and never was. ITU‑T G.107 has folded late arrivals into effective loss since 2015; RFC 3611 and RFC 7002 define discard metrics separately from network loss; G.1072 and P.1203 treat a frame past its deadline as lost. A packet that arrives too late really is gone, and the standards have said so for years.

We built a game‑client simulation whose only measure of harm is how far, in metres, the client drew an opponent from where they actually were. Measured frame by frame, the mechanism is close to deterministic: the correlation between how stale the client’s information was and how wrong its picture was came out at 0.95, and the damage climbs from a millimetre at 25 ms of staleness to almost two metres past 200 ms. Late packets wreck netcode, and the harm scales with exactly how late.

What broke was our instrument, not the idea. A miss percentage is a count: it scores a packet 2 ms past the tick the same as one 400 ms past it, and throws away the magnitude that does the damage. Pre‑registered and run three times, that percentage lost to plain packet loss every time. It is the worst‑performing form of the metric we have measured.

What won, confirmed on a fresh seed, is the figure this page already puts beside the two grids above: the longest continuous hole, in milliseconds. How long you went without current information, whether the packets were late or never turned up at all. It beat conventional loss by a clear margin on both client models we tried, and it beat our own headline percentage by a mile. So the percentage has come off the front of this page and the hole length has gone on it. Scroll back up; that is what the headline figure is now. We have not commissioned the human study; the winning number has changed twice this week and should settle first.

Read the study and the data The preregistrations

The preregistrations, the results and the raw JSON are published whether they suit us or not. Provenance marking used throughout the product: a figure is either checked against the primary document, asserted by research we have not independently verified, or nobody has established it. A number with no mark is a design parameter we chose, not a finding. The figures elsewhere on this page come from a seeded sample session and not from a real connection.